EF Core Query Plans in VS Code: EFCore Visualizer 1.0

Installing EFCore Visualizer for VS Code
Since 2024, EFCore Visualizer has shown the execution plan of an Entity Framework Core query in Visual Studio while you debug (I demoed it on the Visual Studio channel). Many .NET developers write their code in Visual Studio Code (VS Code), though, so I built a version of the extension for VS Code too. EFCore Visualizer 1.0 is on the Visual Studio Marketplace, and it shows the same plan pages as the Visual Studio extension, for SQL Server, PostgreSQL, Oracle and SQLite.
You can install it from the Extensions view by searching for “EFCore Visualizer”, or from the command line:
code --install-extension GiorgiDalakishvili.vscode-efcore-visualizer
It needs VS Code 1.90 or newer and Microsoft’s C# extension, which provides the .NET debugger. Your app needs EF Core 7 or newer, on .NET 6 or newer.
Viewing a query plan
Let’s say you have a query like this:
var recentPosts = context.Posts
    .Where(p => p.Blog.Rating >= 4 && p.PublishedOn >= since)
    .OrderByDescending(p => p.PublishedOn)
    .Select(p => new { p.Title, p.PublishedOn, BlogUrl = p.Blog.Url });
Put a breakpoint after it and start debugging. When the app stops, hover over recentPosts in the Variables or Watch view and click the Visualize Query Plan button at the end of its row. You can also right-click the query and choose Visualize Query Plan:
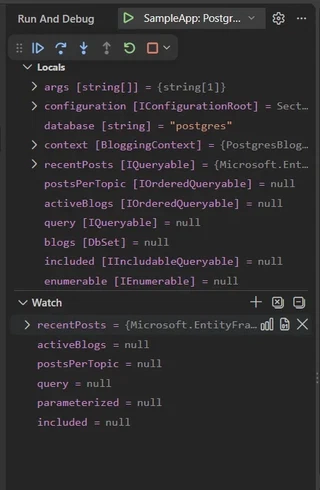
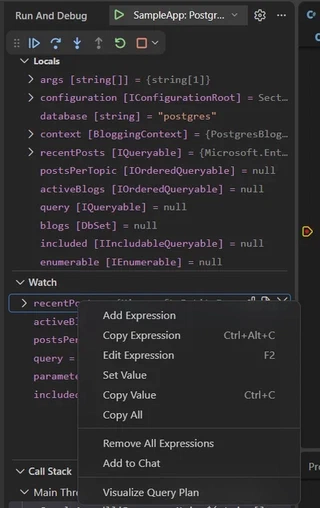
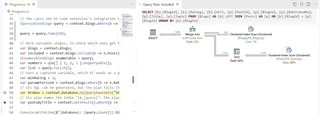
The button appears only on EF Core queries. The plan opens in a tab beside your code, where you can look at the query and its plan at the same time:
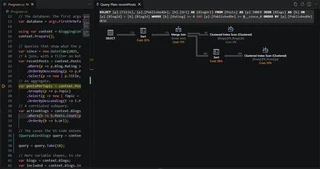
You can also run EFCore Visualizer: Visualize Query Plan from the Command Palette and type an expression that returns a query, such as context.Posts.Take(5). Lambdas don’t work in that expression, but a query in a variable can use them as usual.
One tab per query
Each variable gets its own tab, which lets you open the plans of two queries side by side and compare them. When you visualize a variable again, its tab comes to the front, and if the query changed in the meantime, the tab gets the new plan.
The Refresh button in the tab’s title bar gets the plan again, which is useful after the data changed. The Copy SQL button copies the query’s SQL with its parameter values declared, ready to run in your database tool.
SQL Server and PostgreSQL plan views
Visual Studio and VS Code show the same pages. SQL Server plans are drawn by html-query-plan, the library I first used in LINQPad.QueryPlanVisualizer and kept when I updated it for EF Core. PostgreSQL plans are drawn by pev2:
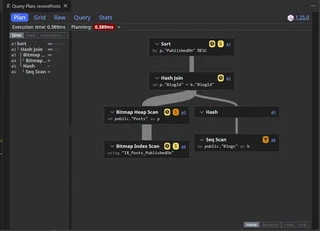
The page follows your VS Code color theme, and it changes when you switch themes:
Actual execution plans and debugger timeouts
For SQL Server, PostgreSQL and Oracle, the extension shows the actual execution plan, with real row counts and timings. To get it, the extension runs the query in your app, on the app’s own connection. For SQLite it asks for EXPLAIN QUERY PLAN, and the query doesn’t run.
In Visual Studio the debugger stops an evaluation after about 5 seconds, and a slow query fails to get its plan. VS Code’s C# debugger has no such limit for the extension’s calls, so slow queries get their plans as well. The query can’t be cancelled, though, and your app stays paused until it finishes.
How it works without a visualizer API
Visual Studio has an API for debugger visualizers. An extension registers a visualizer for a type, and Visual Studio shows a magnifying glass next to every variable of that type. VS Code’s equivalent is still a proposed API, and extensions that use proposed APIs can’t be published to the Marketplace. That is why the VS Code extension puts its button in the Variables and Watch views instead of in the debug hover.
When you click the button, the extension sends the debugger C# expressions to evaluate in the paused app, the same way the Debug Console does when you type an expression there. The first expression loads a helper DLL from the extension’s folder:
System.Reflection.Assembly.LoadFrom(@"C:\Users\you\.vscode\extensions\giorgidalakishvili.vscode-efcore-visualizer-1.0.0\dist\netcoreapp\EFCore.Visualizer.Core.dll")
The helper is built from the same code that the Visual Studio extension runs in the debugged app. Once it is loaded, the extension passes your variable to it. For the recentPosts query from the beginning of the post, the expression is:
IQueryableObjectSource.QueryPlanHelper.GetPlanFile(recentPosts)
GetPlanFile gets the DbCommand for the query from EF Core and picks a database provider based on the command’s type:
public static string GetPlanFile(object query)
{
    var queryable = AsQueryable(query);

    using var command = queryable.CreateDbCommand();
    var provider = GetDatabaseProvider(command) ?? throw new NotSupportedException($"Unsupported database provider {command.GetType().FullName}");

    var queryString = queryable.ToQueryString();
    var rawPlan = provider.ExtractPlan();

    return GeneratePlanFile(provider, queryString, rawPlan);
}
As you can see, there is nothing VS Code specific in it, which is why Visual Studio runs the same code. Each provider knows how to ask its database for the plan. The PostgreSQL provider prepends EXPLAIN ANALYZE to the query and reads the plan from the result:
protected override string ExtractPlanInternal(DbCommand command)
{
    command.CommandText = "EXPLAIN (ANALYZE, COSTS, VERBOSE, BUFFERS) " + command.CommandText;

    using var reader = command.ExecuteReader();
    var plan = string.Join(Environment.NewLine, reader.Cast<IDataRecord>().Select(r => r.GetString(0)));

    return plan;
}
GeneratePlanFile puts the plan into the page template for the database and writes the page to a temporary file. The evaluated expression returns the file’s path, and the extension reads the file and shows the page in a webview.
The webview has a strict content security policy that allows no network access. The plan contains your query’s parameter values and statistics about your data, and the page has no way to send them anywhere.
Feedback
If something doesn’t work, or you’d like a feature, please open an issue. A rating on the Marketplace and a star on the repository help other people find it.


I’m a backend engineer and software architect with 17+ years of .NET, mostly in banking and fintech: payment and transaction processing, public APIs, and the internal platforms other teams build on. I’ve led teams and a platform unit, and I stay hands-on in the code, increasingly through AI coding agents like Claude Code and Codex.
Alongside that, I build open-source .NET libraries and developer tools with 46M+ NuGet downloads: DuckDB.NET, EntityFramework.Exceptions, EFCore.Visualizer and others. That work sits where .NET meets the database: native interop, Native AOT extensions for DuckDB and PostgreSQL, and tooling that makes query plans easier to debug. I also speak about .NET and databases at conferences like NDC, KCDC and .NET Conf.